I talk a lot with my clients and in my Instagram stories (Follow me @JessicaThiefels) about how important it is to stay on top of your social media analytics and let the data guide your strategy. I shared my August content reporting last month (which includes both social media and content marketing data), but I haven’t given you a run-down on what you should be tracking and what the data could be telling you.
That’s what we’re going to do here. And don’t worry if you’re “not a math person” (like me!), you’ll still be able to get deep into your data and pull out insights. Keep reading to find out what high-level social media analytics and data points you should be tracking and why. I’m also sharing what questions to ask and what insights you can glean from that data month after month.
Data Point: Clicks to Site
Answers the question: Am I converting?
The whole point of being on social media is to drive sales, right? Likely, the most streamlined way of doing so is to drive clicks to your site. Once they’re on your site, you’ve gotten them one step closer a converted follower. That makes this most important metric for you to track.
If you don’t tend to make sales through your website, but more through conversations, check out “Messages” below, where I talk about that as an alternative to this metric. Note, however, that if you have a website, you still want to be driving people there.
Find the data: Head to Google Analytics > Acquisition > All Traffic > Source/Medium
In that dashboard, you should be able to see exactly where all your data came from. Note that Twitter is always represented as T.co and there may be a variety of sources for Facebook.
Questions to ask if your clicks are high:
- Which posts drove those clicks? If you’re tagging all your posts with UTM parameters, you’ll be able to dig deeper to see that. Otherwise, you’ll need to go into your social media analytics and see which posts drove the most clicks.
- How can I repeat what went well? Something is clearly is working—how can you do more of the same thing?
Questions to ask if your clicks are low:
- Did I share links to my site often enough? We tend to share articles from friends, fellow boss ladies or our favorite publications—but are you sharing links to your site? Check out my course on repurposing (via Skillshare) if you’re interested in finding more ways to share the same link over and over again.
- Am I developing an audience that’s interested in my business? If people are only interested in pictures of you in cool places, you may not be getting a lot of value from your content. (Unless you’re a travel blogger, or something similar, of course!)
Similar important data points to track:
- Leads from social media
- Sales from social media
- Freebie downloads from social media
Data Point: Engagement Rate
Answers the question: Am I attracting potential customers/clients?
Engagement rate is a metric I wasn’t using until recently and I’ll tell you why I love it, on both a personal and professional level. On a personal level, like you, I work hard to gain more followers each month—really hard. When I first found this metric, I thought, “Well, my engagement rate is going to be in the toilet.”
Quite the contrary, it was huge! For August, my engagement rate was more than 700 percent! That means my very little following is super engaged with my posts—or my hashtags are successfully expanding my reach, which is ideal.
I realized that this metric is a great reminder that your social media isn’t all about tracking your follower count. While that vanity metric is important, it doesn’t hold a lot of value. If you have 5,000 followers but no engagement, there’s no value for your business, other than potentially earning brand equity, I.E. more people recognizing your brand.
On a professional level, I love tracking engagement rate because it tells us one important thing: is my engagement growing along with my followers? If your messaging is on point, your brand is clear, and your voice is consistent, this number should grow as your follower count grows.
As you dig into this one, remember that you can calculate engagement rate for the month and on a per post level. You might calculate per post if:
- You’re running a specific campaign (paid or unpaid)
- You’re testing a new posting format and want to compare with the engagement rate of another format
To calculate in either case, you’d use the following simple equation:
Total engagement / Total followers x 100 = engagement ratio
Find the data: If you use Planoly for Instagram, you’ll be able to see total engagements and do the math for that platform right from there. Some tools may provide similar data for Instagram and other platforms, you just may need to dig a bit. (P.S. Check out my favorite content marketing tools!)
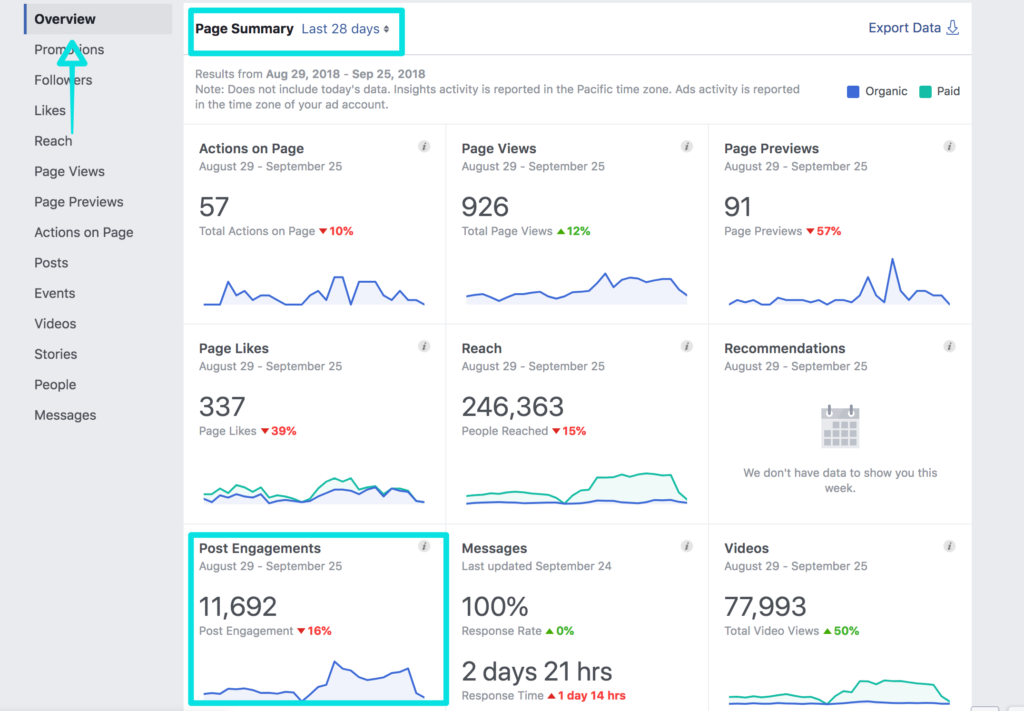
See a screenshot below of where you can find your total engagements within Facebook Insights:
Industry benchmarks for per post engagement rate on the three main platforms (Twitter, Facebook and Instagram), according to RivalIQ’s 2018 report, are as follows:
- Facebook: .16 percent
- Instagram: 1.73 percent
- Twitter: .046 percent
Questions to ask if your engagement is high:
- Start by comparing your engagement rate to industry benchmarks. If yours are higher, that’s great! You’re starting in a good place! Keep doing what you’re doing and check again next month. I haven’t been able to find benchmarks for monthly engagement rate, so you’ll just need to set your own. #trailblazer
Questions to ask if your engagement is low:
- Am I staying on brand?
- Is my posting, voice and style consistent?
- Am I attracting the right audience?
- Am I using hashtags properly? Best practice is to use 9, with the most popular hashtag length being 21 characters, according to the recent data from TrackMaven—you can download their hashtag report here.
Data Point: Comments or Shares
Answers the question: Am I sharing compelling content?
This is an odd metric, but it’s something I’m looking at more and more because it answers a question that’s important to your business: How much of your content is compelling people to talk?
It’s easy to like a post on any platform, but to share it—your audience has to really feel compelled to share something with their audience. Think about it for yourself: how often do you share something to your feed, whether via a RT on Twitter or share on Facebook? For me, very little.=
The same goes for commenting. Your followers have to feel truly invested in what you’re saying or offering to comment on it. Of course you can encourage them to do so, and I recommend you do, by adding “Comment below” as your CTA when appropriate.
Ultimately, this is important to track because an engaged community likes you, potentially even trusts you, and therefore is more likely to buy from you.
Find the data: Again, you can track this for Instagram via Planoly, and otherwise will need to manually count comments and shares from the month. Since that isn’t ideal, it may be wise to track this data for three months to get a sense of where you’re at, and then only check in on the metric once each quarter to make sure you’re maintaining that engagement.
Questions to ask if your comments and shares are high:
- What posts had the most comments or shares? At this point, it’s all about refining; how can you do more of what’s already working?
Questions to ask if your engagement is low:
- Did I ask my audience to engage by using a CTA?
- Am I posting content that my audience would find truly interesting or valuable?
- Am I engaging with my followers too? If you’re not commenting and sharing, how do you expect your followers to do the same for you?
Data Point: Messages
Answers the question: Am I able to convert leads?
This is a good alternative metric if you tend to earn sales by talking with people. This would be as opposed to funneling them through a freebie download, or the like. Realistically, you can’t go to every single networking event or talk to every person you see on the sidewalk. Instead, you can use social media is a tool you to have more of those conversations on a regular basis.
If this sounds like you, adding a few metrics tied to having productive, lead-driving conversations can help you keep track of how much social media is helping your business. Here are a few basic metrics you’d want to look at:
- Total messages (DMs)
- Total messages that turned into warm/hot lead
- Total messages that turned into a sale or free consult
You can also count comments in here if you tend to get questions about your program or products in the comments.
Find the data: You’ll need to check this manually, so just head to your messages within each platform that you use. Count them up and add them to your reporting doc.
Questions to ask if your messages are frequently turning into leads:
- What language are you using that you can bring into other marketing efforts? Maybe your overall messaging could use an update to drive more sales from other outlets.
- How can you automate this process? Are you getting common questions that you can turn into an FAQ PDF that would be helpful and less time-consuming for you?
- Can you turn some of those questions into a digital download to drive leads into a sales funnel?
Questions to ask if your messages don’t frequently turn into leads:
- When does the conversation drop off? When are you losing people? If they tend to drop off after pricing is shared, perhaps you start scheduling that part of the conversation as a video call. They may have more confidence to say yes when they see your face and interact with you more personally.
- Am I engaging with them? Am I also asking questions or am I jumping right to the sale?
- Am I responding in real-time or taking days to answer? Perhaps closing that gap will help you close more sales.
Social Media Analytics Made Easy
Stop counting followers. It’s only stressing you out unnecessarily. What’s more, don’t overwhelm yourself with 15 different metrics if a basic dive when your social media analytics is good enough. Start here, and get consistent—when you’re coming back to the data month after month, you can start adding in new areas of focus. The key is doing this every single month so you can start to pull out insights and get more from your social media efforts.
Need help getting your social media analytics figured out?
Let’s talk about coaching! Message me below with what you need help with.