
Do you look at your Twitter data or do you just schedule Tweets to check a box? According to research by MDGAdvertising, only 73 percent of businesses regularly analyze their social media efforts. Furthermore, only 44 percent have been able to measure the impact of social media on their business.
The problem with this is two-fold:
- You’re not seeing the value of the work you’re putting in.
- You’re missing out on opportunities to grow and reach more potential clients and customers.
If you’re using Twitter to build your personal brand or the brand of your business, you have to quantify your efforts. But where do you start? Use these five Twitter data metrics to understand what’s working, what’s not, what you can change, and what you’re already doing well.
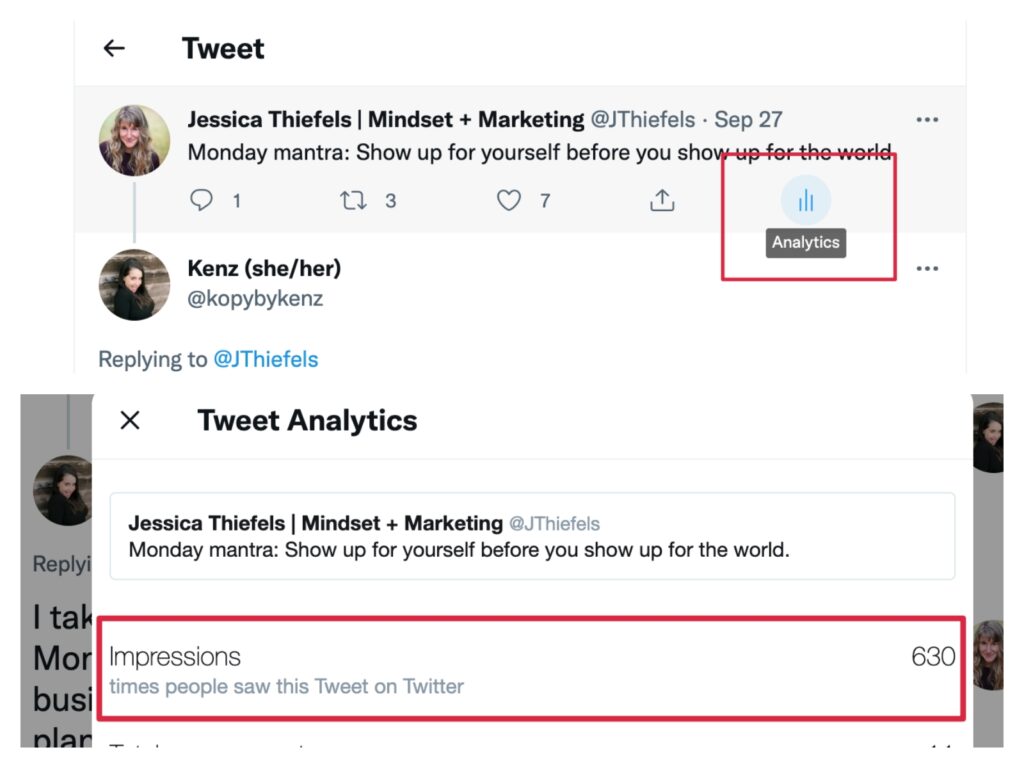
1. Impressions
Impressions refer to the number of people that your tweet is reaching. The higher your impression count, the more people are seeing your content. This is good news if you want to grow your brand—in order to do so, you need to expand impressions so you can reach more people outside your current network and community.
You can view impressions per tweet and overall impressions for the month. This is how to see impressions for each particular tweet:
To see them overall for the month, navigate to your Twitter analytics and then view impressions as part of your Twitter data monthly overview. Both of these metrics—per tweet and monthly—can be helpful:
- Per Tweet: If you’re running a specific campaign, you can see the impressions for each tweet involved, which can help you grasp the success of each campaign post.
- Monthly: Ideally, your monthly impressions are growing or staying the same each month. This shows that you’re continually reaching more and more people outside of your immediate community, which helps you grow.
2. Engagement Rate
The engagement rate refers to the percent of people who like, comment, or share your tweet compared to your total number of followers. The engagement rate is seen as a measure of the quality of a follower base so you can determine how many are listening to what you have to say.
For example, a seemingly popular Twitter account could have 20,000 followers but a poor engagement rate if each tweet only gets one or two likes. A healthier account could only have 2,000 followers but with 10 to 20 likes, comments, and retweets per post means their audience is much more engaged.
The goal is not to build followers just to build them—it’s to develop an engaged community.
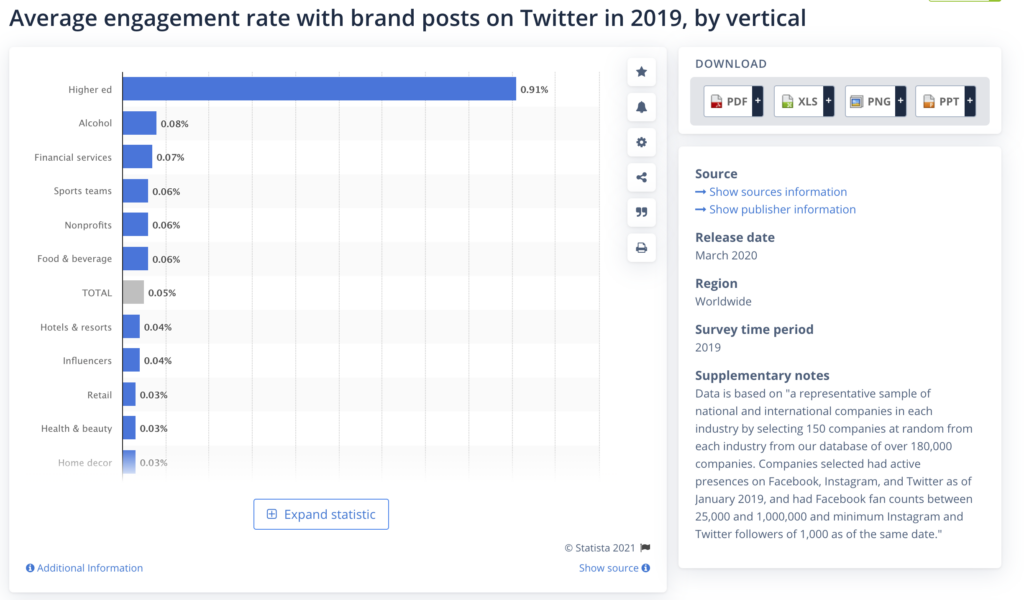
The average engagement rate ranges from one brand and industry to the next. For example, according to Statista, in 2019 the average engagement rate per post for Higher Ed was .91 percent while for financial services it was just .07 percent.
To find this Twitter data, consider two options:
- Per post: Divide the total engagements on your Tweet by your total followers and multiply that by 100.
- Monthly: Divide the total engagements for the month by your total followers and multiply that by 100. You can find total engagements for the month through your social scheduling or analytics platform, like Hootsuite.
3. Profile Visits
If your content is interesting and engaging, then ideally it’s driving people to your profile. As your impressions grow, you may notice a higher number of profile views and followers. This is a good sign. It means that your target audience liked your content so much that they visited your profile to learn more about what you have to say.
Plus, when people visit your profile, they’re more likely to click on the link in your bio, which leads to more website traffic and/or leads.
To find this Twitter data, head to your in-app analytics dashboard (within Twitter) and you’ll find total “Profile Visits” for the month listed. Track this MOM to see if you’re getting more people to your profile, staying the same, or losing traction. If this number is decreasing, consider how your content has changed to cause this shift.

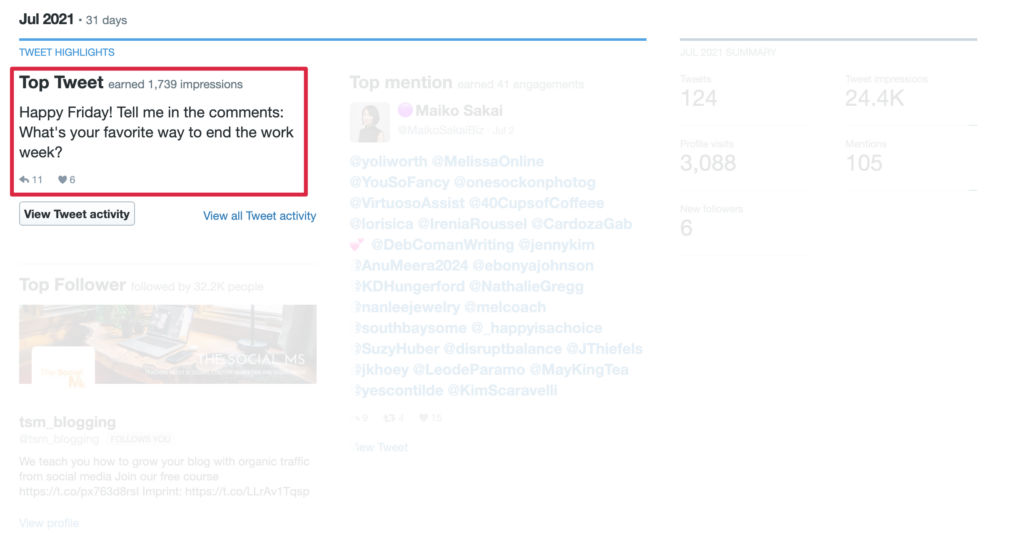
4. Top Tweet
The top tweet is the post that has the highest number of impressions and engagement on your account. When people or businesses “go viral” it’s often because a single tweet spread across the web like wildfire.
Whether you go viral or not, your top tweet gives you an idea about what’s working—from topic to hashtags used. Look at your top tweet and ask:
- What was the post about?
- What media was used (images, video, blog post)?
- Did I tag someone?
- Did I use a new hashtag?
With this information, you can start creating similar content to drive the same results. For example, I noticed my tweets that contained no hashtags and took a more minimalist approach earned more engagement than those that had a link or used hashtags.
I changed my tweets to reflect this and now see significantly more overall engagement than before. Note that you can find this Twitter data in the in-app analytics as well:
5. Total Retweets
Retweets (RT) are powerful because they make it easier for you to organically reach new audiences. If you only have 100 followers but someone with 10,000 followers retweets your post, then your potential for reach and impressions skyrockets. Plus, you may notice an uptick in followers.
Retweets also show how your content resonates with others. A “like” is easy to get—but someone has to truly love your content to RT it because your post then lives on their profile as well. This is why this metric is a powerful indicator of content that’s resonating with your community and audience.
You can find total monthly RTs through your third-party schedule or analytics app, like Hootsuite. Track this data MOM to see if you’re getting more of this powerful engagement. You can also track your top RT’d posts to see what content is resonating most.
Keep Reading: How to Develop Your “Know Like Trust” With Social Media
Don’t Ignore Your Twitter Data
Taking time to look at your Twitter data is key to creating content that your audience likes, which leads to growth and greater ROI. Take time to track this data each month, taking a closer look at your impressions, engagement rate, total retweet, top tweets, and profile visits to figure out what is and isn’t working. Data-based social media management is the only way to see growth—so don’t ignore your Twitter data.